
Location Intelligence for Bakeries

February 17, 2026

9 min to read
Meta Description: Learn why a location intelligence tool like Map AI’s age/sex pyramid is vital for bakeries—optimize site selection, product mix, and marketing by neighborhood.
Why a Location Intelligence Tool’s Age/Sex Pyramid Matters for a Bakery (Using Map AI)
A bakery lives or dies by local demand: who lives nearby, when they buy, and what they prefer. That’s why a location intelligence tool is so valuable—especially one that visualizes your trade area with an age/sex pyramid. In Map AI, you can see the neighborhood’s demographic structure (male/female by age bands) and use it to make smarter choices about bakery location, menu planning, and marketing with far less guesswork.
Unlike generic demographic summaries, an age/sex pyramid is immediately actionable for retail food. It shows whether an area skews toward young families, college-age adults, working professionals, or seniors—each group tends to buy different bakery items at different times and price points.
What the Age/Sex Pyramid Tells You (and Why It’s “Bakery Gold”)
An age/sex pyramid answers one core question: who is your everyday customer within reach of your storefront? For bakeries, that “within reach” often means a close radius. Map AI supports highly granular analysis—down to 1-mile sized cells—so you can understand local demand with precision rather than relying on broad ZIP-code averages.
With the pyramid, you can quickly spot patterns like:
• A heavy 25–44 population (prime commuters and office workers)
• A strong 0–14 segment (families with children)
• A growing 65+ segment (seniors with consistent daytime shopping habits)
• Gender skews that can influence product preferences and campaign creative (useful in aggregate, never as a stereotype)
The takeaway isn’t just “who lives here,” but what bakery concept fits here.
Better Bakery Site Selection: Match Your Concept to the Neighborhood
Choosing a bakery location is not only about rent—it’s about alignment between your offer and your nearby customers. Using Map AI’s demographic layers and pyramid, you can compare candidate sites and see which area has the population structure that best matches your business model.
Examples:
• Family-heavy neighborhoods (0–14 + 30–44): Better for birthday cakes, cupcakes, brownies, family-size packs, and weekend morning traffic.
• Young adult concentrations (18–29): Strong fit for affordable treats, trending items, late-day dessert runs, and delivery-friendly products.
• Working professional areas (25–54): Ideal for premium coffee pairings, breakfast pastries, grab-and-go options, and corporate catering.
• Older populations (60+): Great for classic pastries, lower-sugar options, comfortable seating, and daytime promotions.
Because Map AI lets you analyze locations on an interactive map and compare multiple areas, you can avoid opening a kid-focused bakery in a neighborhood dominated by single adults—or launching a high-priced patisserie where the core customer base may not support it.
Product Mix & Daypart Planning: Bake What Will Actually Sell
Once you know the dominant age groups, you can tune your menu and production schedule to reduce waste and maximize margin. The age/sex pyramid becomes a practical operations tool—helping you decide what to bake more of, and when.
A few high-impact ways bakeries use age structure:
• Morning demand forecasting: Areas with lots of working adults support early croissant/muffin volume and fast checkout.
• After-school spikes: Family-heavy trade areas often see a sharp mid-afternoon bump for snacks and small treats.
• Weekend vs weekday balance: Neighborhoods with families and homeowners may deliver stronger Saturday/Sunday basket size than downtown commuter zones.
• Specialty vs classic assortment: Younger segments may drive novelty and seasonal items; older segments may reward consistency and traditional favorites.
Map AI pairs demographic insights with other location intelligence data (like population, income metrics, and nearby points of interest), so you can validate that your predicted demand also fits spending power and foot traffic realities.
Targeted Marketing: Speak to the Right Customers (Without Wasting Budget)
Bakery marketing works best when it’s local and specific. The age/sex pyramid helps you build campaigns that match community life, not generic personas.
Use it to:
• Choose the right offers (kids-eat-free cookie days vs espresso-and-croissant commuter deals)
• Pick the best channels (community groups and school partnerships vs office catering outreach)
• Set the right timing (morning commuter promos vs afternoon family snack bundles)
Map AI also helps you understand the neighborhood context by showing nearby businesses, schools, stores, and other points of interest—useful for partnership ideas (gyms, schools, coworking spaces) and hyperlocal ad targeting.
How to Use Map AI’s Age/Sex Pyramid for a Bakery (Quick Checklist)
When evaluating a new bakery location or improving an existing one, use this simple workflow:
- Check the age/sex pyramid in the 1-mile area: identify the top 2–3 age bands.
- Validate market size with population counts and households nearby.
- Confirm pricing potential with median income and income distribution insights.
- Compare 2–5 candidate sites using Map AI’s interactive maps and comparison approach.
- Generate a shareable report for stakeholders or investors to support your decision.
This turns “I think this area feels busy” into a data-backed location strategy.
A bakery is a local business—your best decisions should be local-data-driven. Explore Map AI’s age/sex pyramid and full location intelligence toolkit here: https://interactive-map-ai.com/chat

Retirement-friendly

or dominated by young professionals.

Understanding factors like age demographics, neighborhood income, crime rates, and education ranking allows you to feel the vibe of the area more deeply. With Map AI, it’s a breeze to dig into the demographics of any area!
Open mapInstead of manually compiling data from multiple sources, our platform provides real-time insights, saving you time and effort while delivering accurate and actionable information.
Here’s how it works:
1. Launch the platform in your browser.
2. Find the location you’re interested in, by entering an address on the left.
3. Choose the level of data granularity – 1 mi, 5 mi, county or a state.
4. In the menu bar on the right, go to the "Charts" section and select "Population".
5. Click on the neighborhood you’re curious about to view the data.
And voilà!
An interactive map pops up, layered with data on age groups, income brackets, education levels, and even population density.

It’s like having a real estate crystal ball! Whether you’re prioritizing schools, nightlife, or a specific community vibe, Map AI helps you match your lifestyle to the perfect spot. No more guessing or endless Googling—just actionable insights in a few clicks.
Ready to explore? Head to https://interactive-map-ai.com/ and start mapping your future neighborhood today!
Map AI makes exploring demographics easy with its interactive, user-friendly platform. Offering detailed maps and customizable filters, Map AI lets you visualize key demographic data such as age distribution, population density by county, by zip and less, median household income map, and family structures across different neighborhoods. You can access real-time data to make more informed decisions about where to live based on the community that best matches your needs and lifestyle.
Open mapBy using Map AI, you’ll save time and gain a deeper understanding of your potential new home, ensuring you choose the perfect neighborhood for your future.
Check my neighborhoodHere’s why school rankings matter and how Map AI can help you make the best choice.
Why school rankings matter1. Property Value Impact
Homes located in areas with top-rated schools tend to have higher property values and greater potential for long-term appreciation. School quality is a key factor that many homebuyers consider, even if they don’t have children, because it signals a desirable neighborhood with solid community investment.2. Better Educational Opportunities
For families, the proximity to high-ranking schools can be a major deciding factor. Good schools provide better educational opportunities for children, which can translate into future success. Access to quality education is often viewed as a key benefit of living in certain neighborhoods.3. Community Environment
A strong school system often attracts young families, creating a vibrant, family-friendly community. This can lead to a positive social environment with access to various community activities, events, and local organizations.
How Map AI makes comparing school districts simple
Map AI simplifies the process of comparing school districts by offering interactive maps that display school rankings across different neighborhoods.

With just a few clicks, you can visualize how schools in a specific area stack up against each other, compare performance ratings, and see reviews from local residents.
Open mapBy using Map AI, you can make informed decisions about where to buy, ensuring that the neighborhood not only fits your lifestyle but also provides access to the best educational opportunities. Whether you're focused on top-performing schools or simply want to know how a school compares in the area, Map AI makes this data easily accessible and actionable.
Incorporating school rankings into your property search is easy when you have the right tools. With Map AI, you can confidently select a neighborhood that provides excellent education for your children and enhances your home’s long-term value.
For a comprehensive, data-driven approach to analyze a neighborhood, Map AI is the tool you can't afford to miss.
Compare neighborhoodsHow Map AI makes сrime heatmaps easy to use
Map AI takes the power of crime heatmaps to the next level with its user-friendly platform. With just a few clicks, you can explore crime rates by neighborhood that display real-time crime data across America. Map AI’s intuitive interface allows you to customize filters, adjusting the map based on the type of crime you're concerned about, such as violent crimes or property thefts.
You can also zoom in on specific areas to see localized crime patterns, giving you a more detailed view of safety at a granular level. The easy-to-read heatmap visuals make it simple to compare areas, helping you narrow down the safest areas to live in with confidence.
By using Map AI, you get access to accurate, real-time crime data in an easy-to-understand format, making it a must-have tool in your homebuying journey. With Map AI you can make informed decisions that prioritize your safety and peace of mind.
Let us help guide you to the safest places for your next home.

Then select “Filters” from the menu on the right side, choose "Housing" – “Median gross rent” / “ Median home value”, and set your budget.

The map highlights these towns in green, showing median home prices and rental rates.

Zoom in to explore schools, parks, and shopping options—everything a homebuyer needs to decide. Forget endless searches; Map AI puts affordability and convenience on one screen. Check it out at https://interactive-map-ai.com and start planning your move today!
Just for you
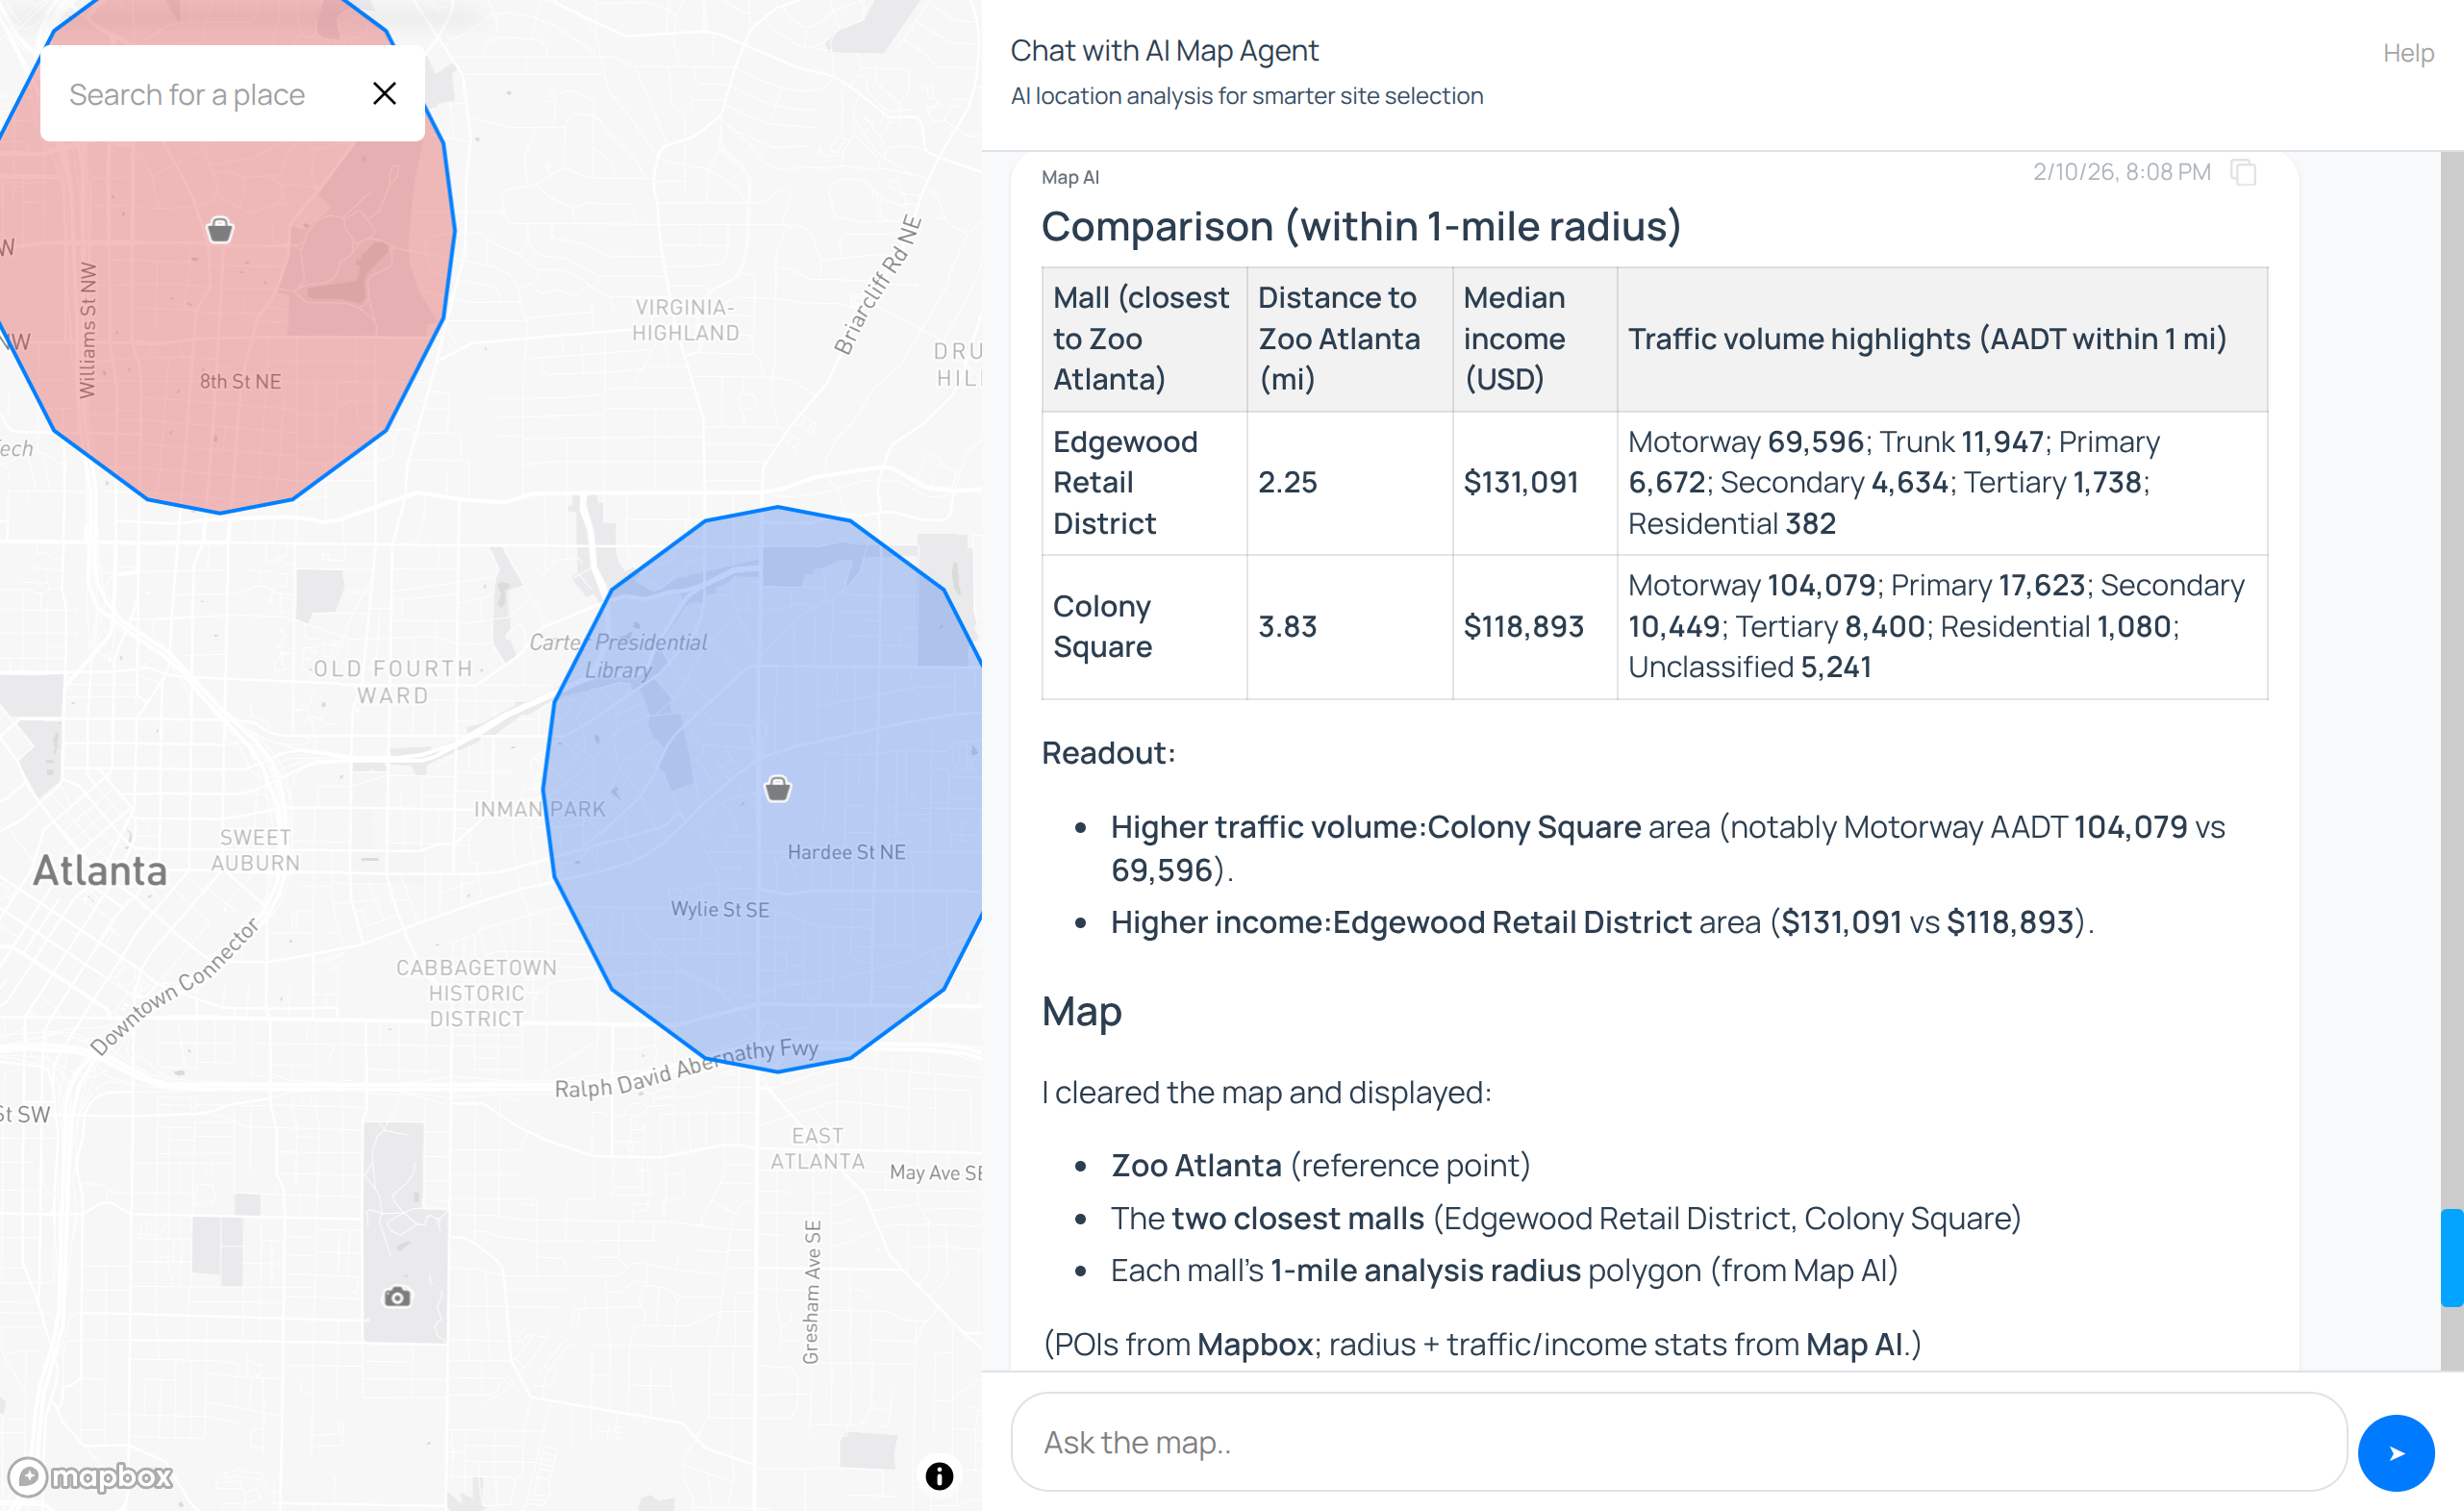
Map AI Agent for Smarter Location Analysis
Discover Map AI Chat, an AI-powered tool that simplifies and visualizes location analysis with real demographic and geographic data, offering interactive, actionable insights for site selection and research.
Read moreStill searching for the right place?
Use Map AI to explore, compare, and find the best fit - all with detailed insights and smart reports on any neighborhood.


