
Still searching for the right place?
Use Map AI to explore, compare, and find the best fit - all with detailed insights and smart reports on any neighborhood.

States with the Fastest-Growing Median Household Income


August 31, 2026

7 min to read
Idaho's median household income went from $56,240 in 2019 to $74,676 in 2023, a gain of 32.78%. The United States as a whole managed 24.98% over the same four years. No state moved faster.
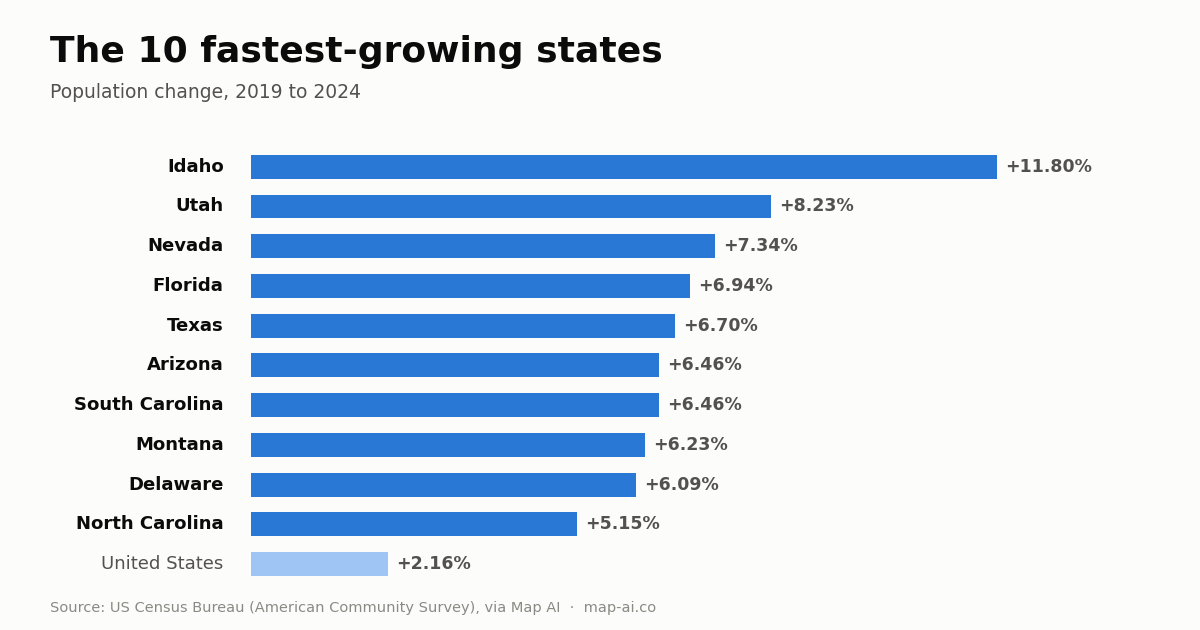
That makes Idaho the only state in the country to finish first in both median income growth and population growth since 2019, which is a rarer combination than it sounds. Fast income growth and fast population growth overlap, but only halfway: five of the ten fastest-growing incomes are not in the ten fastest-growing populations at all, and one of them is losing residents outright.
The 10 fastest-growing median household incomes, 2019 to 2023
| # | State | 2019 | 2023 | Gain | Growth |
|---|---|---|---|---|---|
| 1 | Idaho | $56,240 | $74,676 | +$18,436 | +32.78% |
| 2 | Arizona | $59,036 | $77,100 | +$18,064 | +30.60% |
| 3 | Washington | $73,810 | $95,177 | +$21,367 | +28.95% |
| 4 | Rhode Island | $67,223 | $86,475 | +$19,252 | +28.64% |
| 5 | Utah | $71,844 | $92,351 | +$20,507 | +28.54% |
| 6 | California | $75,247 | $96,718 | +$21,471 | +28.53% |
| 7 | Oregon | $63,010 | $80,923 | +$17,913 | +28.43% |
| 8 | Florida | $56,092 | $71,865 | +$15,773 | +28.12% |
| 9 | Colorado | $72,649 | $93,055 | +$20,406 | +28.09% |
| 10 | North Carolina | $55,033 | $69,937 | +$14,904 | +27.08% |
| - | United States | $62,527 | $78,145 | +$15,618 | +24.98% |
These are nominal dollars, not inflation-adjusted, so the useful comparison is not the raw number but the distance from the national 24.98%. A state at 20% did not get 20% richer. It fell behind the country.
The winners are two different stories wearing the same jersey
Look at where each of the ten started, and the list splits cleanly in half.
Washington, California, Colorado and Utah were already above the national median in 2019 and pulled further ahead. Idaho, Arizona, Florida, North Carolina and Oregon started below the national median. Idaho began the period 10.1% below the US figure and ended 4.4% below it. Arizona began 5.6% below and ended 1.3% below.
So the same ranking contains both a rich-getting-richer story on the Pacific coast and a genuine catch-up story in the interior West and Southeast. Rhode Island is the odd one out on both counts: fourth-fastest growth, above-median income, and a population that grew just 1.07%. The full state-by-state comparison sits on the United States income and wealth page.
Percent growth and dollar growth disagree
Rank by dollars added instead of percentage and the order rearranges.
| State | Dollars added 2019 to 2023 | Percent |
|---|---|---|
| California | +$21,471 | +28.53% |
| Washington | +$21,367 | +28.95% |
| Utah | +$20,507 | +28.54% |
| Colorado | +$20,406 | +28.09% |
| District of Columbia | +$19,959 | +22.87% |
| Idaho | +$18,436 | +32.78% |
California added the most actual money to its median household of any state, $21,471, while losing 364,415 residents. Washington DC added $19,959 and ranks 35th of 51 on percentage growth, because it started from $87,267 and a big base makes a big number look like a small rate.
One honest caveat on California: when lower-income households leave a state faster than higher-income ones, the median rises without any individual household earning more. Median income measures the household in the middle, and the middle moves when the edges move. The California income statistics page shows the level, $96,718 in 2023 and 24% above the national figure, but a level alone cannot separate raises from reshuffling.
Four categories, split on the national benchmark
Sort all 50 states and DC against two lines, the national 2023 median of $78,145 and the national growth rate of 24.98%, and four groups fall out.
Rich and pulling further ahead (7): Washington, Rhode Island, Utah, California, Oregon, Colorado, Vermont. Above the national income level and growing faster than the country. Five of the seven are on the Pacific coast or in the Mountain West; Rhode Island and Vermont are the two that are not.
Catching up (10): Idaho, Arizona, Florida, North Carolina, Georgia, Montana, Tennessee, New Mexico, South Carolina, Nevada. Below the national income level but closing the gap. Nine of these ten also grew their populations faster than the country, which is the cleanest evidence in the data that people and paychecks moved together. New Mexico is the exception, up 25.43% on income with population growth of just 0.66%.
Wealthy but stalling (13): New Hampshire, Massachusetts, New York, Illinois, Minnesota, Virginia, District of Columbia, Delaware, New Jersey, Connecticut, Hawaii, Maryland, Alaska. Rich in level, slower than the nation in growth. Nine of the thirteen are in the Northeast or Mid-Atlantic, and five of them lost population outright. Maryland is the sharpest case: the second-highest income of any state or district at $101,971, and 48th of 51 on growth at 19.55%. Adjusted for inflation that is close to no gain at all, which is the subject of high-income states that are losing momentum.
Falling behind on both (21): the largest group, including Texas, Pennsylvania, Ohio, Michigan, Wisconsin, Missouri, Indiana, Iowa, Kansas, Nebraska, Oklahoma, Louisiana, Mississippi, Arkansas, Alabama, Kentucky, West Virginia, Maine, South Dakota, North Dakota and Wyoming. Below the national income level and growing slower than the country. Two out of every five states are in this quadrant.
Where the money actually is
Growth rankings hide levels, and the levels are stark.
Only four places cleared $100,000 in 2023: the District of Columbia at $107,226, Maryland at $101,971, Massachusetts at $101,501 and New Jersey at $101,200. California, at $96,718, did not make it. At the bottom sit Mississippi at $55,084, West Virginia at $57,886 and Arkansas at $58,772. The full spread between the top and bottom is broken down in richest vs poorest states by median household income.
The distance between the top and the bottom is roughly stable in ratio and widening in dollars. DC's median was 1.936 times Mississippi's in 2019 and 1.947 times in 2023. But the dollar gap grew from $42,198 to $52,142, an increase of $9,944 in four years. Proportional convergence and absolute divergence are happening at the same time, and which one you call progress depends on whether you are pricing a percentage or a mortgage.
People and paychecks are correlated, not the same thing
Across all 50 states and DC, population growth from 2019 to 2024 and income growth from 2019 to 2023 have a correlation of 0.537. Real, moderate, and nowhere near a straight line.
The disagreements are where it gets interesting. Texas ranks 5th in the country on population growth and 31st on income growth at +23.25%, below the national rate. Delaware ranks 9th on population and 39th on income at +22.11%. Both added people quickly while their median household fell behind the country.
Running the comparison the other way, California ranks 6th on income growth while losing population, and Rhode Island ranks 4th on income growth with population up just 1.07%. Adding residents does not automatically raise the median, and raising the median does not require adding residents. The population side of this picture is broken out in the 10 states with the fastest-growing population.
The slowest movers
Wyoming grew 15.62%, Alaska 15.89% and North Dakota 16.33%, the three slowest in the country and all roughly nine points behind the national rate.
All three are small, resource-heavy economies where a narrow set of industries sets the median, and all three entered 2019 already above the national figure of $62,527, which leaves less room for catch-up gains. North Dakota shows the pattern most clearly: it grew 17.02% over the five years to 2019 and 16.33% over the four years to 2023, while the country accelerated from 17.05% to 24.98% across the same two windows. The nation sped up. North Dakota did not.
The nine-year view reshuffles the podium
Stretch the window back to 2014 and Idaho loses first place.
| # | State | 2014 to 2023 | Rank since 2019 |
|---|---|---|---|
| 1 | Oregon | +59.89% | 7th |
| 2 | Washington | +57.67% | 3rd |
| 3 | Idaho | +57.59% | 1st |
| 4 | California | +56.71% | 6th |
| 5 | Colorado | +56.20% | 9th |
| 6 | District of Columbia | +54.45% | 35th |
| 7 | Arizona | +54.39% | 2nd |
| 8 | Utah | +54.27% | 5th |
| 9 | Rhode Island | +52.08% | 4th |
| 10 | Florida | +51.93% | 8th |
Nine of these ten are also in the four-year top ten, so the story is durable rather than a post-2020 artifact. The exception is the District of Columbia, 6th over nine years and 35th over four. DC did the bulk of its income growth in the 2010s and has coasted since, which is the same shape as its population: up through 2020, then down 1.60% by 2024.
See more
Source: US Census Bureau, American Community Survey, as processed by Map AI. Median household income figures are the 2014, 2019 and 2023 vintages of Map AI's median-household-income-by-year series, the latest available. Population growth figures cover 2019 to 2024. All dollar amounts are nominal.
- Compare median household income across every state on the interactive map
- United States income and wealth
- Idaho income statistics and Washington income statistics
- High-income states that are losing momentum, the same data adjusted for inflation
- The 10 states with the fastest-growing population
- Richest vs poorest states in America by median household income
- Map AI data sources

Retirement-friendly

or dominated by young professionals.

Understanding factors like age demographics, neighborhood income, crime rates, and education ranking allows you to feel the vibe of the area more deeply. With Map AI, it’s a breeze to dig into the demographics of any area!
Open mapInstead of manually compiling data from multiple sources, our platform provides real-time insights, saving you time and effort while delivering accurate and actionable information.
Here’s how it works:
1. Launch the platform in your browser.
2. Find the location you’re interested in, by entering an address on the left.
3. Choose the level of data granularity – 1 mi, 5 mi, county or a state.
4. In the menu bar on the right, go to the "Charts" section and select "Population".
5. Click on the neighborhood you’re curious about to view the data.
And voilà!
An interactive map pops up, layered with data on age groups, income brackets, education levels, and even population density.

It’s like having a real estate crystal ball! Whether you’re prioritizing schools, nightlife, or a specific community vibe, Map AI helps you match your lifestyle to the perfect spot. No more guessing or endless Googling—just actionable insights in a few clicks.
Ready to explore? Head to https://interactive-map-ai.com/ and start mapping your future neighborhood today!
Map AI makes exploring demographics easy with its interactive, user-friendly platform. Offering detailed maps and customizable filters, Map AI lets you visualize key demographic data such as age distribution, population density by county, by zip and less, median household income map, and family structures across different neighborhoods. You can access real-time data to make more informed decisions about where to live based on the community that best matches your needs and lifestyle.
Open mapBy using Map AI, you’ll save time and gain a deeper understanding of your potential new home, ensuring you choose the perfect neighborhood for your future.
Check my neighborhoodHere’s why school rankings matter and how Map AI can help you make the best choice.
Why school rankings matter1. Property Value Impact
Homes located in areas with top-rated schools tend to have higher property values and greater potential for long-term appreciation. School quality is a key factor that many homebuyers consider, even if they don’t have children, because it signals a desirable neighborhood with solid community investment.2. Better Educational Opportunities
For families, the proximity to high-ranking schools can be a major deciding factor. Good schools provide better educational opportunities for children, which can translate into future success. Access to quality education is often viewed as a key benefit of living in certain neighborhoods.3. Community Environment
A strong school system often attracts young families, creating a vibrant, family-friendly community. This can lead to a positive social environment with access to various community activities, events, and local organizations.
How Map AI makes comparing school districts simple
Map AI simplifies the process of comparing school districts by offering interactive maps that display school rankings across different neighborhoods.

With just a few clicks, you can visualize how schools in a specific area stack up against each other, compare performance ratings, and see reviews from local residents.
Open mapBy using Map AI, you can make informed decisions about where to buy, ensuring that the neighborhood not only fits your lifestyle but also provides access to the best educational opportunities. Whether you're focused on top-performing schools or simply want to know how a school compares in the area, Map AI makes this data easily accessible and actionable.
Incorporating school rankings into your property search is easy when you have the right tools. With Map AI, you can confidently select a neighborhood that provides excellent education for your children and enhances your home’s long-term value.
For a comprehensive, data-driven approach to analyze a neighborhood, Map AI is the tool you can't afford to miss.
Compare neighborhoodsHow Map AI makes сrime heatmaps easy to use
Map AI takes the power of crime heatmaps to the next level with its user-friendly platform. With just a few clicks, you can explore crime rates by neighborhood that display real-time crime data across America. Map AI’s intuitive interface allows you to customize filters, adjusting the map based on the type of crime you're concerned about, such as violent crimes or property thefts.
You can also zoom in on specific areas to see localized crime patterns, giving you a more detailed view of safety at a granular level. The easy-to-read heatmap visuals make it simple to compare areas, helping you narrow down the safest areas to live in with confidence.
By using Map AI, you get access to accurate, real-time crime data in an easy-to-understand format, making it a must-have tool in your homebuying journey. With Map AI you can make informed decisions that prioritize your safety and peace of mind.
Let us help guide you to the safest places for your next home.

Then select “Filters” from the menu on the right side, choose "Housing" – “Median gross rent” / “ Median home value”, and set your budget.

The map highlights these towns in green, showing median home prices and rental rates.

Zoom in to explore schools, parks, and shopping options—everything a homebuyer needs to decide. Forget endless searches; Map AI puts affordability and convenience on one screen. Check it out at https://interactive-map-ai.com and start planning your move today!
Just for you
10 States with the Fastest-Growing Population
Idaho, Utah and Nevada led US population growth from 2019 to 2024, and 10 states took 77% of everything the country added.
Read more
Still searching for the right place?
Use Map AI to explore, compare, and find the best fit - all with detailed insights and smart reports on any neighborhood.


