
Still searching for the right place?
Use Map AI to explore, compare, and find the best fit - all with detailed insights and smart reports on any neighborhood.

10 States with the Fastest-Growing Population

August 31, 2026

6 min to read
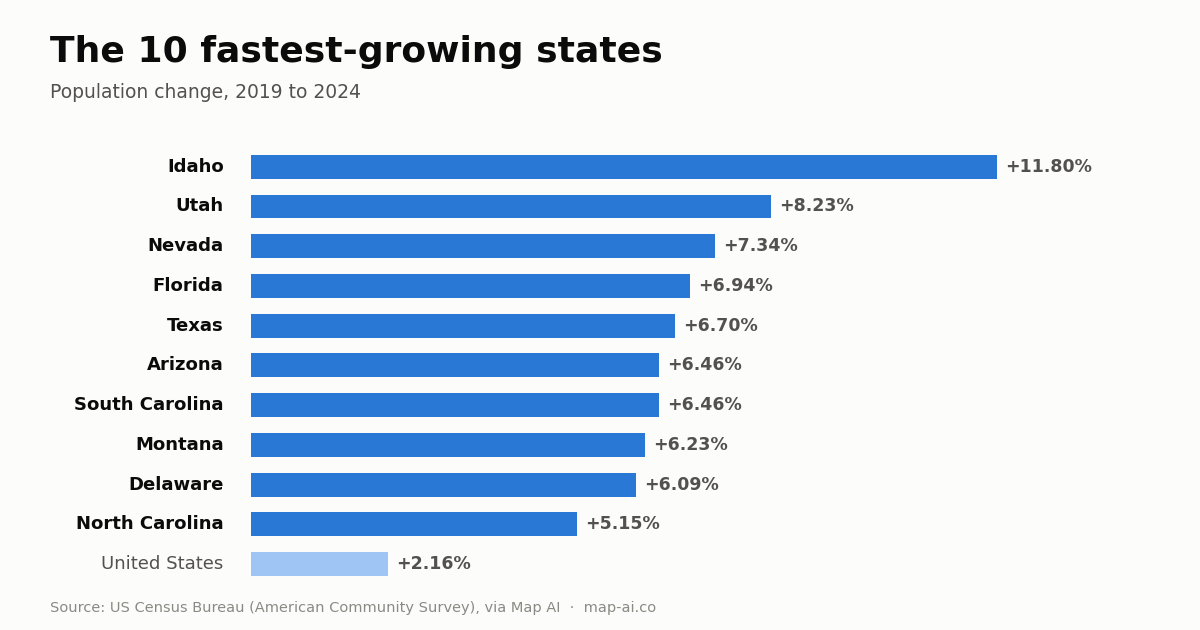
Idaho added 202,609 people between 2019 and 2024, a gain of 11.80% that runs about five and a half times faster than the 2.16% the United States managed as a whole. No other state came close. That single number is the cleanest way to see what has happened to American migration since 2020: growth did not just continue, it concentrated.
The ten fastest-growing states below absorbed 5,448,934 of the 7,070,251 people the country added over those five years. That is 77% of all national growth landing in ten states that hold under a third of the population.
The 10 fastest-growing states, 2019 to 2024
| # | State | 2019 | 2024 | Added | Growth |
|---|---|---|---|---|---|
| 1 | Idaho | 1,717,631 | 1,920,240 | +202,609 | +11.80% |
| 2 | Utah | 3,099,665 | 3,354,668 | +255,003 | +8.23% |
| 3 | Nevada | 2,968,522 | 3,186,464 | +217,942 | +7.34% |
| 4 | Florida | 20,869,100 | 22,318,419 | +1,449,319 | +6.94% |
| 5 | Texas | 28,251,279 | 30,143,883 | +1,892,604 | +6.70% |
| 6 | Arizona | 7,041,717 | 7,496,660 | +454,943 | +6.46% |
| 7 | South Carolina | 5,017,703 | 5,341,662 | +323,959 | +6.46% |
| 8 | Montana | 1,050,861 | 1,116,316 | +65,455 | +6.23% |
| 9 | Delaware | 957,491 | 1,015,835 | +58,344 | +6.09% |
| 10 | North Carolina | 10,261,307 | 10,790,063 | +528,756 | +5.15% |
| - | United States | 327,751,480 | 334,821,731 | +7,070,251 | +2.16% |
Percentage growth and raw growth tell two different stories, and the table holds both. Montana and Delaware make the top ten on 65,455 and 58,344 new residents respectively, numbers small enough to fit inside a single mid-sized county. Texas and Florida rank fifth and fourth on percentage but between them account for 3,341,923 people, which is 47% of everything the country gained. Half of American population growth over five years happened in two states.
Why Idaho runs away with it
Idaho is the least crowded state on this list except Montana, at 22.97 people per square mile against a national 85.77, and well under Nevada's 28.83 or Arizona's 65.78. Growth that would barely register in Texas moves Idaho's percentage sharply, because the denominator is small and the state started from a low base.
But the pressure is real rather than statistical. Idaho's median household income rose from $56,240 in 2019 to $74,676 in 2023, a 32.8% gain that is the fastest of any state in the top ten and well ahead of the national 25.0%. Median home value over the same period went from $187,066 to $355,887, a 90.2% increase. The full picture sits on the Idaho demographics page, which tracks the state's population, income and density against national figures.
A photo finish for sixth place
Arizona grew 6.4607% and South Carolina grew 6.4563%. The gap between them is 44 ten-thousandths of a percentage point. Another 221 South Carolinians would have erased it entirely, out of a state of 5.3 million. For practical purposes they tied.
What separates them is scale and price. Arizona added 454,943 people to South Carolina's 323,959, and Arizona's median home value climbed 68.6% since 2019 against South Carolina's 42.2%. South Carolina is the cheapest of the ten by home value at $224,357, which is close to the national $242,182 and helps explain why the inflow has not slowed.
The growth map moved east
Compare the last five years against the last ten and two states fall out of the picture. Over 2014 to 2024, Colorado ranked 8th nationally at +12.55% and Washington ranked 9th at +11.72%. Over 2019 to 2024, Colorado dropped to 15th at +4.26% and Washington to 12th at +4.88%.
Delaware and North Carolina took their places. The Mountain West and Pacific Northwest tech corridors that drove the 2010s have cooled, and the Southeast and the interior West picked up the slack. Anyone reading a growth ranking published before 2021 is reading a map that no longer exists.
Two very different kinds of growth
The ten states do not share a demographic profile. Map AI's 2023 median age puts Utah at 32.8 years and Texas at 35.8, both under the national 37.1. At the other end sit Delaware at 42.3, Montana at 40.4, Florida at 40.2 and South Carolina at 40.1.
That is the difference between a state growing on births and young households and a state growing on people arriving near or after retirement. It changes what the growth needs. Utah's growth wants schools, starter homes and daycare capacity. Delaware's wants healthcare, single-level housing and a tax base that does not depend on a large working-age population. Delaware is also the densest state on the list at 408.47 people per square mile, nearly five times the national figure and fifty-four times Montana's 7.58, so the same 6% growth rate lands on completely different ground.
What the growth costs
Fast growth shows up in housing before it shows up anywhere else.
| State | Median home value 2019 | 2023 | Change | Price to income 2023 |
|---|---|---|---|---|
| Idaho | $187,066 | $355,887 | +90.2% | 4.77 |
| Utah | $251,534 | $457,939 | +82.1% | 4.96 |
| Arizona | $201,763 | $340,223 | +68.6% | 4.41 |
| North Carolina | $161,201 | $265,624 | +64.8% | 3.80 |
| Florida | $193,324 | $293,727 | +51.9% | 4.09 |
| Nevada | $235,304 | $338,659 | +43.9% | 4.48 |
| South Carolina | $157,807 | $224,357 | +42.2% | 3.35 |
| Texas | $181,826 | $248,418 | +36.6% | 3.25 |
| Montana | $203,314 | $242,768 | +19.4% | 3.49 |
| Delaware | $211,005 | $249,028 | +18.0% | 2.98 |
| United States | $173,729 | $242,182 | +39.4% | 3.10 |
Utah is the most stretched of the ten. Its price-to-income ratio moved from 3.50 in 2019 to 4.96 in 2023, the largest deterioration in affordability of any state on this list, and that is despite Utah having the highest median household income of the ten at $92,351. Utah is also one of only five states that rank in the top ten for both population growth and median household income growth. The state's housing market page breaks the numbers down against national medians.
Renters felt it too. Median gross rent rose 35.9% in Arizona, 35.5% in Utah, 34.8% in Idaho and 34.4% in Nevada, against 26.8% nationally.
Two states escaped the squeeze. Delaware and Montana posted the smallest home-value increases of the ten, and both ended 2023 with price-to-income ratios under 3.5. Delaware at 2.98 is the only state in the top ten that is more affordable relative to local income than the United States as a whole. Note that these are American Community Survey owner-estimated values rather than closed sale prices, so they trail the transaction market by a year or more, which matters most for Montana where the run-up came early and fast.
The other end of the list
Growth this concentrated means someone is losing people. Between 2019 and 2024, Connecticut fell 3.40%, New York fell 2.86%, West Virginia fell 2.44% and Illinois fell 2.15%. California lost 364,415 residents, a 0.93% decline, and New York lost 559,196.
The New York and California losses alone come to 923,611 people, more than the combined gains of Idaho, Nevada, Montana and Delaware. The country did not stop growing. It rearranged.
See more
Source: US Census Bureau, American Community Survey, as processed by Map AI. Population figures are the 2019 and 2024 vintages of Map AI's population-by-year series; income, home value, rent and median age series run through 2023.
- Compare population growth across every state on the interactive map
- United States demographics overview
- Texas demographics and Florida demographics
- North Carolina housing market and Montana demographics
- States with the fastest-growing median household income, the paycheck side of the same migration
- Map AI data sources

Retirement-friendly

or dominated by young professionals.

Understanding factors like age demographics, neighborhood income, crime rates, and education ranking allows you to feel the vibe of the area more deeply. With Map AI, it’s a breeze to dig into the demographics of any area!
Open mapInstead of manually compiling data from multiple sources, our platform provides real-time insights, saving you time and effort while delivering accurate and actionable information.
Here’s how it works:
1. Launch the platform in your browser.
2. Find the location you’re interested in, by entering an address on the left.
3. Choose the level of data granularity – 1 mi, 5 mi, county or a state.
4. In the menu bar on the right, go to the "Charts" section and select "Population".
5. Click on the neighborhood you’re curious about to view the data.
And voilà!
An interactive map pops up, layered with data on age groups, income brackets, education levels, and even population density.

It’s like having a real estate crystal ball! Whether you’re prioritizing schools, nightlife, or a specific community vibe, Map AI helps you match your lifestyle to the perfect spot. No more guessing or endless Googling—just actionable insights in a few clicks.
Ready to explore? Head to https://interactive-map-ai.com/ and start mapping your future neighborhood today!
Map AI makes exploring demographics easy with its interactive, user-friendly platform. Offering detailed maps and customizable filters, Map AI lets you visualize key demographic data such as age distribution, population density by county, by zip and less, median household income map, and family structures across different neighborhoods. You can access real-time data to make more informed decisions about where to live based on the community that best matches your needs and lifestyle.
Open mapBy using Map AI, you’ll save time and gain a deeper understanding of your potential new home, ensuring you choose the perfect neighborhood for your future.
Check my neighborhoodHere’s why school rankings matter and how Map AI can help you make the best choice.
Why school rankings matter1. Property Value Impact
Homes located in areas with top-rated schools tend to have higher property values and greater potential for long-term appreciation. School quality is a key factor that many homebuyers consider, even if they don’t have children, because it signals a desirable neighborhood with solid community investment.2. Better Educational Opportunities
For families, the proximity to high-ranking schools can be a major deciding factor. Good schools provide better educational opportunities for children, which can translate into future success. Access to quality education is often viewed as a key benefit of living in certain neighborhoods.3. Community Environment
A strong school system often attracts young families, creating a vibrant, family-friendly community. This can lead to a positive social environment with access to various community activities, events, and local organizations.
How Map AI makes comparing school districts simple
Map AI simplifies the process of comparing school districts by offering interactive maps that display school rankings across different neighborhoods.

With just a few clicks, you can visualize how schools in a specific area stack up against each other, compare performance ratings, and see reviews from local residents.
Open mapBy using Map AI, you can make informed decisions about where to buy, ensuring that the neighborhood not only fits your lifestyle but also provides access to the best educational opportunities. Whether you're focused on top-performing schools or simply want to know how a school compares in the area, Map AI makes this data easily accessible and actionable.
Incorporating school rankings into your property search is easy when you have the right tools. With Map AI, you can confidently select a neighborhood that provides excellent education for your children and enhances your home’s long-term value.
For a comprehensive, data-driven approach to analyze a neighborhood, Map AI is the tool you can't afford to miss.
Compare neighborhoodsHow Map AI makes сrime heatmaps easy to use
Map AI takes the power of crime heatmaps to the next level with its user-friendly platform. With just a few clicks, you can explore crime rates by neighborhood that display real-time crime data across America. Map AI’s intuitive interface allows you to customize filters, adjusting the map based on the type of crime you're concerned about, such as violent crimes or property thefts.
You can also zoom in on specific areas to see localized crime patterns, giving you a more detailed view of safety at a granular level. The easy-to-read heatmap visuals make it simple to compare areas, helping you narrow down the safest areas to live in with confidence.
By using Map AI, you get access to accurate, real-time crime data in an easy-to-understand format, making it a must-have tool in your homebuying journey. With Map AI you can make informed decisions that prioritize your safety and peace of mind.
Let us help guide you to the safest places for your next home.

Then select “Filters” from the menu on the right side, choose "Housing" – “Median gross rent” / “ Median home value”, and set your budget.

The map highlights these towns in green, showing median home prices and rental rates.

Zoom in to explore schools, parks, and shopping options—everything a homebuyer needs to decide. Forget endless searches; Map AI puts affordability and convenience on one screen. Check it out at https://interactive-map-ai.com and start planning your move today!
Just for you

States with the Fastest-Growing Median Household Income
Idaho, Arizona and Washington led US median household income growth since 2019, and the winners split into catch-up states and rich states pulling further ahead.
Read more
Still searching for the right place?
Use Map AI to explore, compare, and find the best fit - all with detailed insights and smart reports on any neighborhood.


